Dynamic Light Scattering (DLS)

Dynamic Light Scattering Main Image
DLS distribution of trimodal polystyrene latex with particles of 22, 100, and 700 nm diameter, occurring in a ratio of 3:1:1, respectively.

Dynamic light scattering (DLS) is an indirect, high-throughput method for measuring the sizes – by hydrodynamic diameter (HDD) – of particles in a solution.

Strengths

  • Fast, automated analysis = rapid results
  • Accepts low sample concentrations
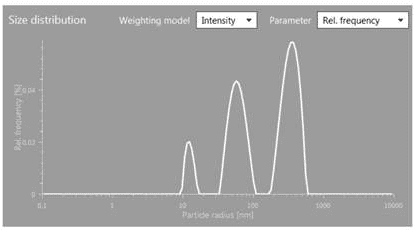
  • Provides overall particle size distribution
  • Works well with a wide range of particle sizes
  • Nondestructive analysis

Limitations

  • Does not provide particle shape information for irregular geometries
  • Heavy particles can sometimes sediment, causing artifacts
  • Bigger particles are higher-weighted in the raw intensity distribution

Learn More

Dynamic Light Scattering Services

Dynamic Light Scattering

Dynamic light scattering (DLS) is an indirect, high-throughput method for measuring the sizes – by hydrodynamic diameter (HDD) – of particles in a solution.

Sample Requirements

Example Outputs

DLS distribution of trimodal polystyrene latex with particles of 22, 100, and 700 nm diameter, occurring in a ratio of 3:1:1, respectively.

Instruments Used

Anton Paar Litesizer 500

Anton Paar Litesizer 500

The Litesizer 500 from Anton Paar is the only DLS-based particle analyzer able to perform a straightforward measurement of the sample’s refractive index at the exact wavelength and temperature of a given measurement. This ensures its maximal accuracy for particle size and zeta potential analysis.

  • Particle Diameter Range: 0.3 nm to 10 µm
View Instrument Brochure

How DLS Works

Particles suspended in a liquid are constantly undergoing random Brownian motion, and their size directly affects their speed: smaller particles move faster than larger ones.

When a laser light source is applied to an aqueous sample of particles in solution, it scatters around them as it passes. The scattered light is detected and recorded at some pre-defined angles and the time-dependence of changes in the scattered intensity profiles can be correlated to the particles’ speed, and therefore to their average size and distribution throughout the system.

Plots of the relative frequency of distinct particle sizes and speeds can then be generated for subsequent analysis.