Spectral Ellipsometry (SE)

Spectral Ellipsometry Main Image
Thickness map of a resist coating on silicon wafer substrate

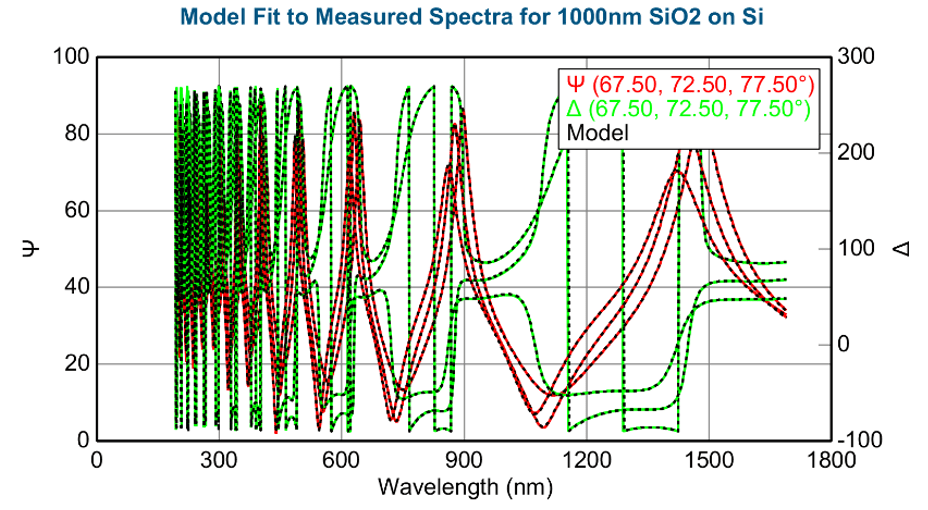
Spectral ellipsometry (SE) – also called “spectroscopic ellipsometry” – is a non-contact, non-destructive optical characterization technique that can be used to assay numerous physical, optical, and topographical properties simultaneously and indirectly.

With the development of appropriate analysis models, examples of material properties that can be measured by ellipsometry include:

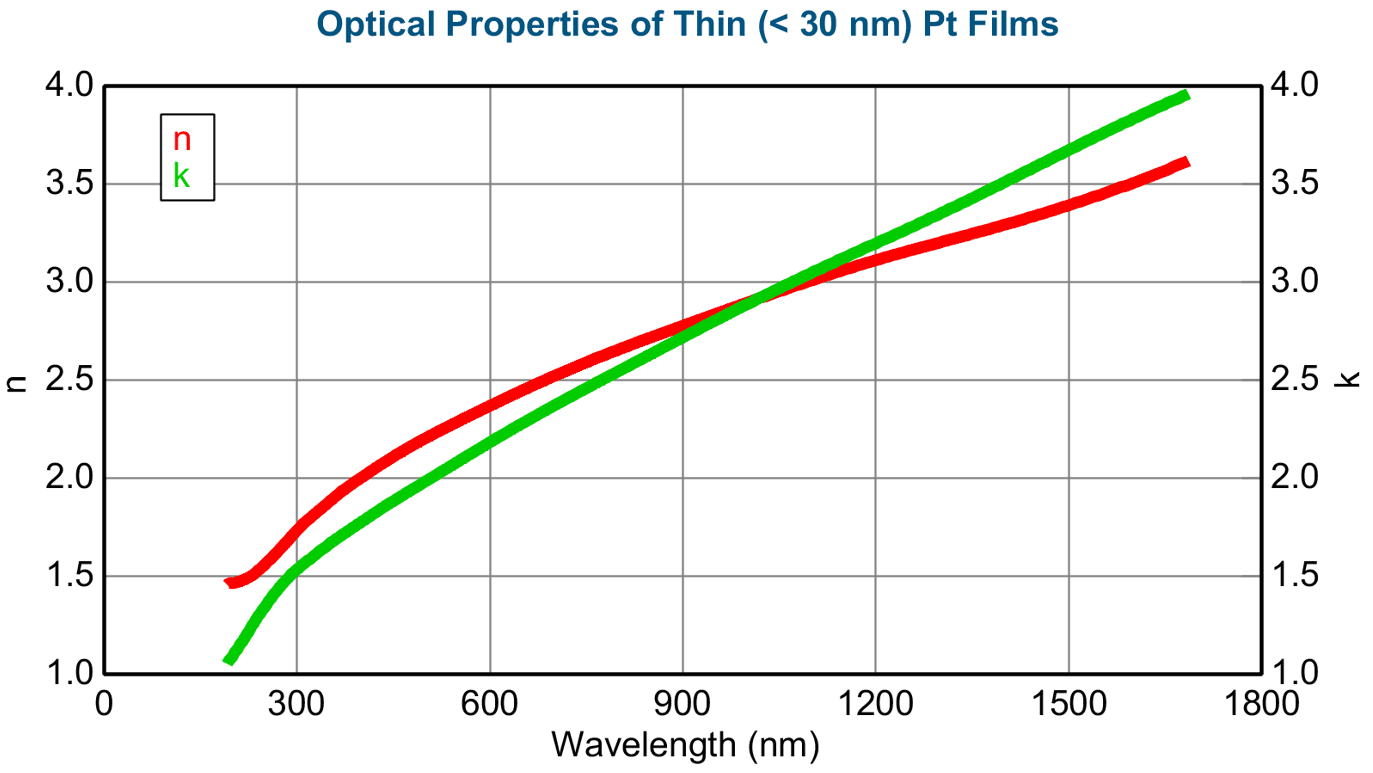
  • Layer thickness and optical properties (n, k)
  • Surface and interface properties
  • Film density and porosity
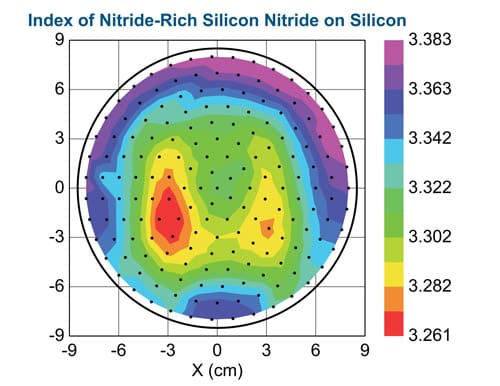
  • Material quality and homogeneity
  • Layer composition
  • Birefringence
  • Bandgap energy in semiconductors
  • Depth gradients
  • Monolayer coverage

Strengths

  • Data collection is generally quick and straightforward
  • Precise and reproducible
  • Very sensitive to ultra-thin films (single angstroms thick)

Limitations

  • Measured region on the sample must be smooth and flat
  • Complex modeling required to access most indirect properties – often requires extensive expertise to avoid analytical pitfalls
  • Analysis of multi-layered samples sometimes requires fabrication of intermediate test samples with fewer layers to uniquely determine the properties of all layers present

Learn More

Spectral Ellipsometry Services

Traditional Ellipsometry

View Example Report

Covalent is a leading provider of cutting-edge ellipsometry measurement services, and we excel in providing customized modeling solutions that are fine-tuned to the characteristics of your samples and overall project goals. We have deep experience in projects ranging from routine film thickness measurements to complex, application-specific model development for novel materials or multilayer structures.

Batch Inspection Ellipsometry

View Example Report

Our batch inspection service offers a cost-efficient solution for quality control and qualification of a large volume of sample replicates (10+).

This service leverages the excellent precision of ellipsometry to provide a statistical understanding of variation in sample batches.  Typically, this is used to qualify a set of coatings or substrates from a vendor or to check for variation and/or uniformity in thin film deposition, etch, or other processes.

Frequently Asked Questions

Spectroscopic ellipsometry is an optical measurement technique most commonly used to determine the thickness and optical constants (n, k) of thin films or surfaces. It involves measuring the changes in light polarization arising from interaction with the sample as a measurement beam is reflected from the surface or transmitted through the bulk of a sample.

The raw data obtained in a spectroscopic ellipsometry measurement (psi, delta) fundamentally contains information about how the polarization amplitude and phase of the measurement light beam have been modified by the sample as a function of wavelength. Beyond raw data, however, the results of interest are usually sample properties such as layer thickness and/or index of refraction. To obtain the final results, an optical model is fit to the raw data where the iterative adjustment of model parameters determines their best-fit values that reproduce the measured spectra. Development of this optical model varies from simple to highly complex such that the cost of model development is typically project-dependent.

Since ellipsometry requires reflection from or transmission through a sample, smooth and flat surfaces are needed. A good rule of thumb is that you should be able to see reflections in the surface of the sample. For samples with layers, our in-house ellipsometer can typically handle thicknesses in the range of 0.1 nm – 1 micron easily, and thicknesses in the 1 – 10 micron range if the samples are very uniform. General sample sizes should be anywhere between ~1mm all the way up to 300mm.

Although the most common and straightforward uses of ellipsometry are for measuring film thickness and optical constants (n, k), ellipsometry can be used to measure a variety of other properties. Additional applications include measuring material composition, depth gradients, surface treatment, optical bandgap, interfacial diffusion, electrical conductivity, and many others. Almost all of these rely on the fact that the optical constants determined by ellipsometry are influenced by a variety of other material properties such that correlation between optical constants and other properties allows for indirect measurement of these properties. Covalent specializes in development of custom data analysis models that are designed for our customers’ specific applications.

Spectroscopic ellipsometry non-destructive and relatively quick. Additionally, it is extremely sensitive to layer thicknesses with sub-angstrom precision in the best cases. Ellipsometry is also applicable to measuring uniformity of samples by collecting mapping data that consists of a grid of measurements over samples as large as 300mm.

Sample Requirements

Example Outputs

1000 nm SiO2 on Si spectroscopic ellipsometry raw data and model fit

Index of refraction mapped across nitride-rich SiNx film on a silicon wafer substrate

Thickness map of a resist coating on silicon wafer substrate

Example optical properties for partially transparent (< 30 nm) Pt thin films

Instruments Used

J.A. Woollam RC2-DI

J.A. Woollam RC2-DI

  • Spectral Range: 193 to 1690 nm (0.73 to 6.42 eV; 1075 total wavelength bands)
  • Dual-rotating compensator configuration (PCSCRA configuration)
  • Automated mapping up to 300 mm substrates w/ fully customizable X-Y resolution and scan pattern
  • Measurement Beam Diameter: 5 mm (standard); or 300 µm (focused)
  • Full Muller matrix measurement capability
  • Variable-angle transmission stage (45° – 90° angle-of-incidence range)
View Instrument Brochure

How SE Works

In an SE system, a beam of set wavelength and known initial polarization state is either reflected by (or transmitted through) the sample to be measured.

A detector measures the changes to the beam’s polarization state vectors induced by interactions with the sample. This produces a raw data set capturing polarization at each measured wavelength; however, this is almost always the starting point of analysis.

In order to determine many properties of interest, Advanced Modeling is required. This involves computationally fitting thickness and optical properties of layers in the sample to the raw spectra, enabling indirect determination of these material attributes, and numerous other more abstract characteristics (such as: surface roughness, interfacial layers, diffusion profiles, composition, crystallinity, and more).