Glow Discharge Optical Emission Spectroscopy (GDOES)
Glow Discharge Optical Emission Spectroscopy Main Image
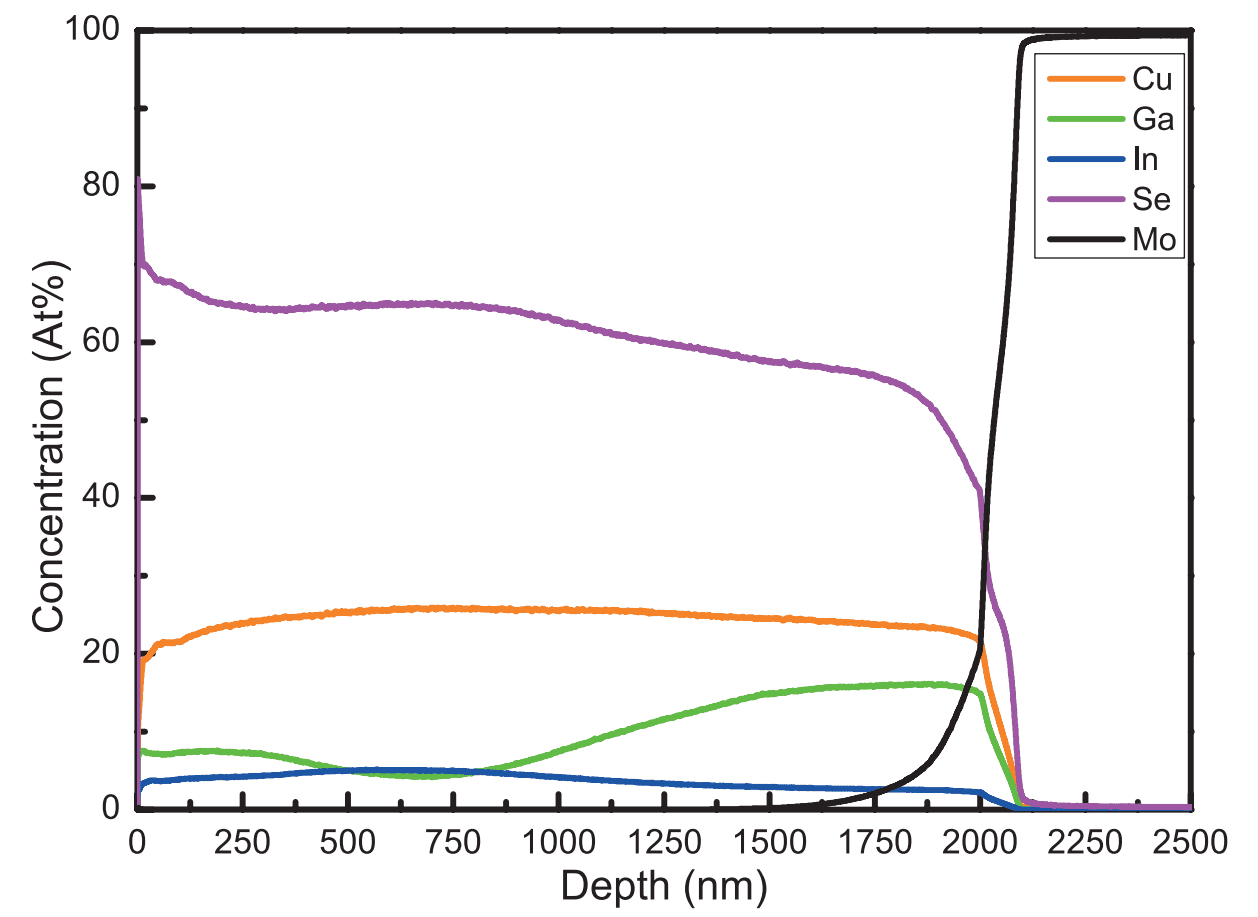
Depth profile of CuInGaSe Solar Cell shows how GDOES can be used to extract quantitative compositional information as a function of penetration depth into a sample, after some additional analytical steps are performed.

Glow discharge optical emission spectroscopy (GDOES) is a quantitative, chemical analytical technique used to study the elemental composition of solids. It is particularly well suited for analysis on thin- and thick-film samples, or for depth-profiling of multilayer film stacks.

Strengths

  • Accepts both conductive and insulating materials
  • Faster data collection and depth profiling than mass spectroscopy techniques
  • Reduced mass interferences improve compositional accuracy for low-mass elements
  • One tool for surface, depth profile, and bulk analysis
  • Can detect light elements such as H, C, N, O that methods like ICP-MS cannot detect

Limitations

  • Lower sensitivity for trace elements as compared to GDMS
  • Requires more extensive calibration for accurate quantification with matrix effects

Learn More

Glow Discharge Optical Emission Spectroscopy Services

Glow Discharge Optical Emission Spectroscopy

Glow discharge optical emission spectroscopy (GDOES) is a quantitative, chemical analytical technique used to study the elemental composition of solids. It is particularly well suited for analysis on thin- and thick-film samples, or for depth-profiling of multilayer film stacks.

Sample Requirements

Example Outputs

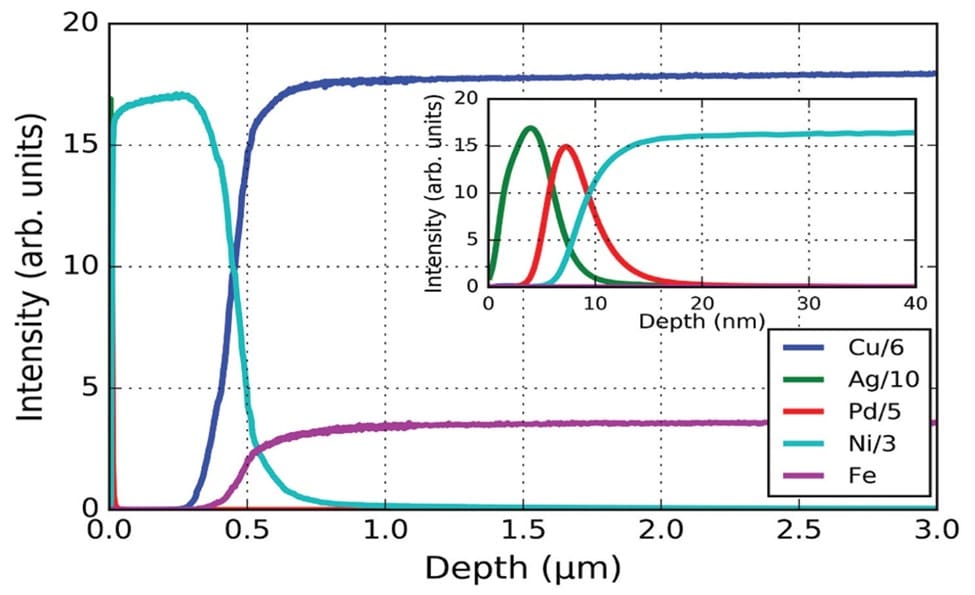
Depth profile of BGA with zoom on surface showing layers in the first 20 nanometers. Relative concentration is reflected in the arbitrary units of signal intensity, as the quantitative composition has not been calculated.

Depth profile of CuInGaSe Solar Cell shows how GDOES can be used to extract quantitative compositional information as a function of penetration depth into a sample, after some additional analytical steps are performed (as described in This Application Note).

From: Horiba

Instruments Used

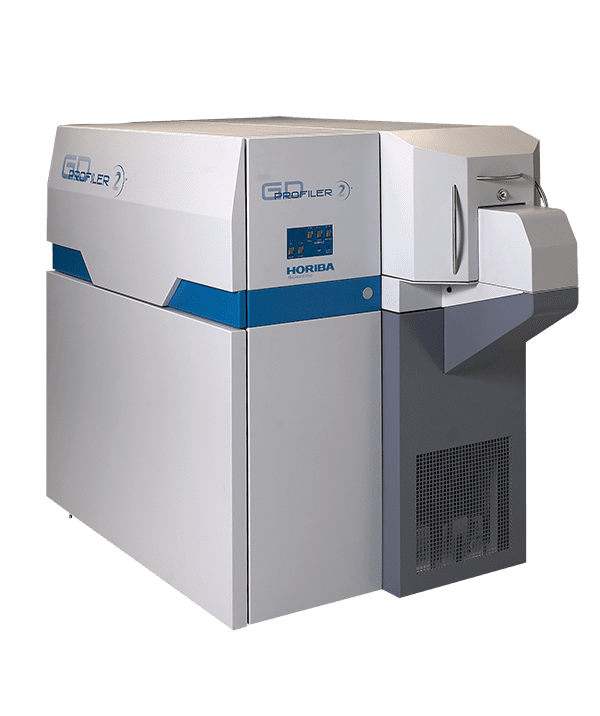
HORIBA Scientific GD Profiler 2

HORIBA Scientific GD Profiler 2

  • Spectral Range: 120 nm to 800 nm
  • Simultaneous measurement of all elements; including light elements H, C, N, O, F, Li
  • Lateral Resolution: 2-8 mm
  • Depth resolution as low as ~1 nm
  • High Dynamic Detector with industry-leading integration times and linear dynamic acquisition range (5 x 10⁹)
  • Plasma Sputtering Ion Energy: 50eV
  • Pulsed Plasma Gas Ion Frequency: 13.56 MHz RF
  • Anode Tube Diameter: 4mm
View Instrument Brochure

How GDOES Works

GDOES generates signal by ablating surface atoms – making this another excellent method for bulk or surface element analysis, and for studying composition variance as a function of depth.

In a GDOES measurement, a low-pressure, glow-discharge (GD) plasma of Argon or other gas mixtures (depending on the material) is used to sputter away the surface of the sample being measured.

Once the sample particles are released, the high energy plasma induces subsequent fluorescence events characteristic of the elements in the plasma. These photons are detected by an optical emission spectrometer (OES) module, which captures the intensity of light associated with each unit photon energy.

The final spectrum of peaks will have measured energies corresponding to the unique orbital energies of its parent element. By comparing the amplitudes of these peaks, one can quantitatively determine the elemental composition of each layer in a sample surface, bulk, or depth profile.