White Light Interferometry (WLI)
White Light Interferometry Main Image
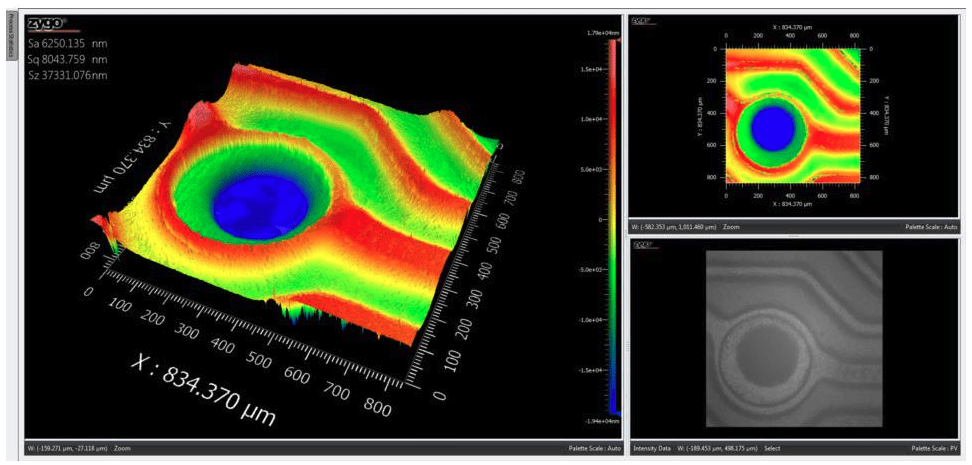
WLI_Sample Output-3D Circuit Board Feature.

White light interferometry (WLI) is a non-destructive, non-contact, optical surface topography measurement that uses coherence scanning interferometry to generate 2D and 3D models of surface height.

Strengths

Limitations

  • Steep cut-offs and sharp topography angles impair WLI measurement accuracy around these features
  • Interpretation of fringe changes can be difficult in certain types of samples

Learn More

White Light Interferometry Services

White Light Interferometry

White light interferometry (WLI) is a non-destructive, non-contact, optical surface topography measurement that uses coherence scanning interferometry to generate 2D and 3D models of surface height.

Sample Requirements

Example Outputs

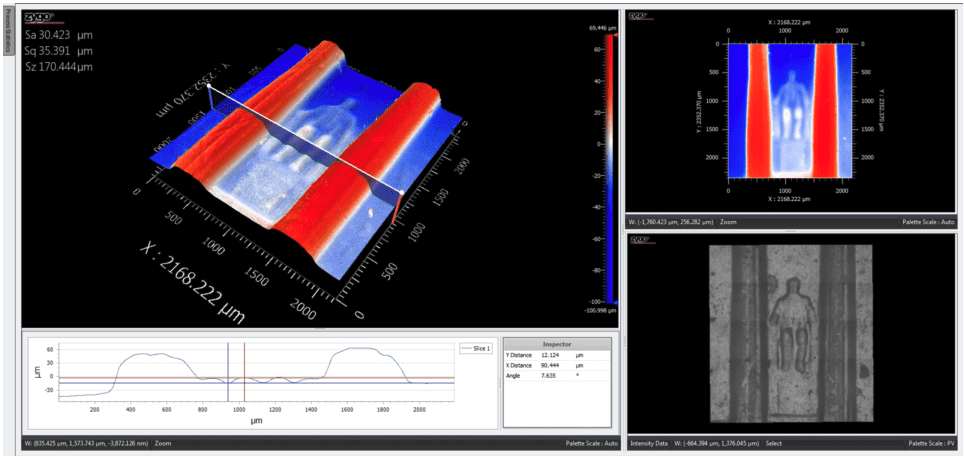
3D WLI measurement: the figure of Lincoln sitting in his monument on the surface of a US 1 cent coin (barely visible with the naked eye), visualized clearly with WLI.

3D WLI measurement of a circuit board feature.

Instruments Used

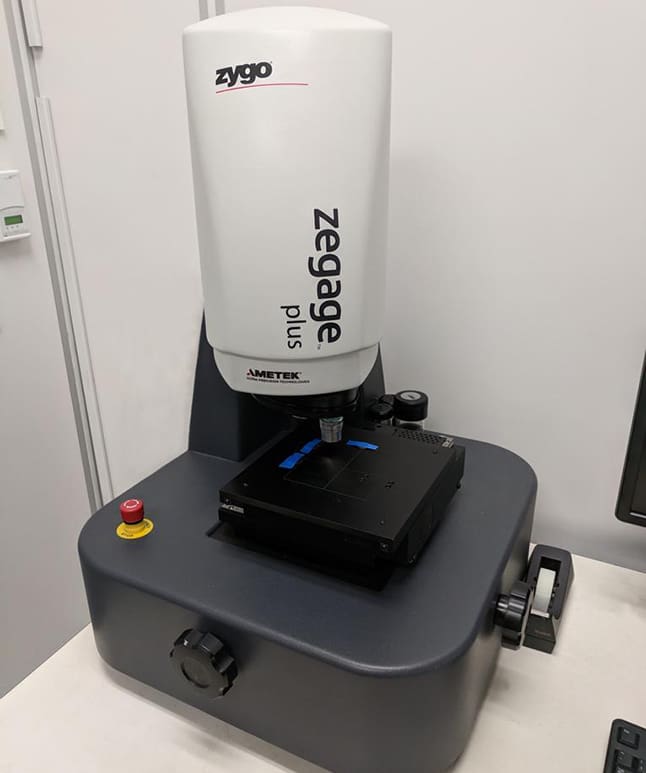
Zygo Zegage Plus

Zygo Zegage Plus

  • Magnification Range: 10x to 50x
  • Maximum Vertical Scan Range: 20 mm
  • Surface Topography Reproducibility: ≤ 0.15 nm
  • Optical Lateral Resolution: 0.52 μm
  • Step Height Accuracy: ≤ 3%
View Instrument Brochure

How WLI Works

WLI instruments use a white light source to illuminate the surface of the sample.

A beam-splitter divides the white light beam into two optical paths: one that reflects or scatters from the sample and one that reflects from a flat, known reference mirror. These two signal beams are then mixed together and the resulting image is projected onto a CCD image sensor.

The two beams, when mixed, form an interference pattern whose intensity can be related to the sample surface height: any difference in optical path length between the reference and sample beams changes the measured interference intensity at each scanned point, providing an indirect measure of the height variance in the sample.

The interference fringes are analyzed at each point to build up a 3D map of the sample surface.